It’s a call that many would find all-too-familiar: “time’s up, so get those last guesses bubbled in.”
I recently said something similar to one of my students, which meant that he had to guess on the last four questions. As we graded, I was mildly surprised to see he managed to get all four of those guesses correct. Since this was the ACT math, a section with 5-option multiple-choice questions, the odds of him managing four guesses in a row were a meager 625 to 1. Not impossible, but certainly not likely. It got me thinking: how many questions in a row would a student need to guess correctly to have the same chance as winning the Powerball?
To answer this, a few pieces of information were needed:
First, we’d of course need to know the odds of winning the Powerball jackpot. From their own website, the jackpot odds are 1/292,201,338. Talk about a long shot!
Next, we need to be clear on an important multiplication rule in probability. If we want to know the likelihood of guessing a single multiple choice question correctly, we simply take the number of correct choices (1) and divide by the total number of options (typically 4). This gives us a single-question guessing chance of ¼.
However, if we want to know the chance of a few separate events happening in sequence—so long as the outcome of one doesn’t influence the others—you have to multiply the probabilities of each event. This would make the chances of guessing three questions in a row
(¼)(¼)(¼), or

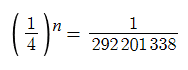
In fact, the odds of guessing n questions in a row can be written as

So, if want to know what number of questions n would equate to the same odds of our lottery jackpot, the equation we need to solve becomes
This can be solved using logarithms:
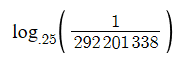
which leads us to our final answer: 14.06
This means that guessing 14 questions in a row is nearly just as (un)likely as winning the Powerball jackpot! Now, it isn’t a perfect representation, as the answer is a little above 14, but the error is only about 8%. I’d invite you all to go on and try to guess 14 questions in a row… in fact, try to guess a meager four in a row. Right now. Pick four random letters A-D. Think of them, in a particular order, but don’t tell me what you chose. Write them down if you have to. Then click here for the answer key.
Did you get all four right? I’d wager not. Less than a quarter of 1% of guessers would get all four right, and each successive question only makes it harder. The odds of getting all 14 are astronomically small. In fact, to help put this all into perspective, that means guessing 15 questions in a row on a standard A/B/C/D test is about 4x harder than winning the Powerball jackpot. You read that right: you’d be expected to win the jackpot four times before you ever manage to guess 15 questions in a row! Talk about a rough time guessing out there…
Now, for most, the above calculations would put the question to bed. We figured out that 14 questions is a pretty-close-to-perfect simulation of the lottery jackpot. But close-to-perfect isn’t good enough for me.
The question then evolved: since the ACT features some multiple choice questions that have five options, could our model be made more accurate if we allowed for combinations of four-option and five-option multiple choice questions? Could that percent error be reduced any lower than 8%?
To figure this out, I decided to graph every mix of four-option and five-option questions that combined to our target probability of 1/292,201,338. Here’s what the model looked like:
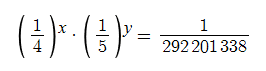
A way to interpret this would be: I have x questions that have four options, and y questions that have 5 options. The cumulative probability of getting all of those questions right is their product, and that product should be 1/292201338.
Time to get charting! Surprisingly, this graph outputs a line.
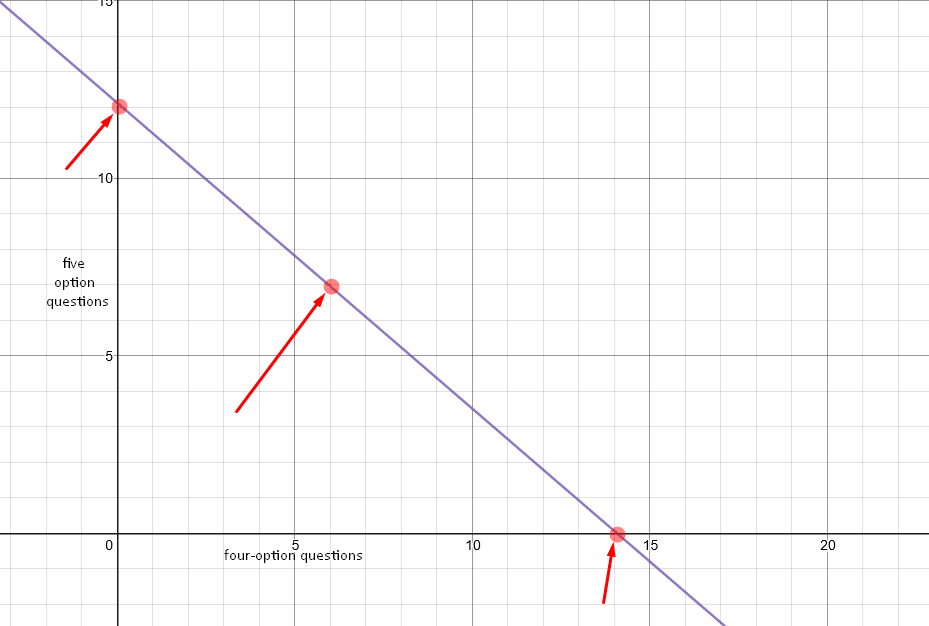
Since we’re only interested in places featuring positive integer numbers of each questions (because a test with 11.32 multiple choice questions seems a little strange), we’re only interested in places where this graph crosses near intersections of our grid points. I’ve highlighted the three best candidates above. They suggest that the three best models are
- 14 four-option questions and no five-option questions
- 6 four-option questions and 7 five-option questions
- 12 five-option questions and no four-option questions
After computing the probabilities of each of those points, it turns out that the best metric is still our original, reigning champion: 14 four-option questions.
So, what’s the main takeaway? Study. While guessing can make a positive difference on any standardized test and is always better than leaving blanks, it also won’t work miracles. If you’re hoping to bluff your way through a tough section, you might as well buy a lottery ticket while you’re at it… chance is against you in either case.
Stay tuned for a later blog post where we’ll break down the odds of guessing an entire ACT test correctly! If 14 questions is already as tough as the lottery, what about more than 200? The answer’s got our heads spinning here and we can’t wait to share it.